1.Coating thickness detection.
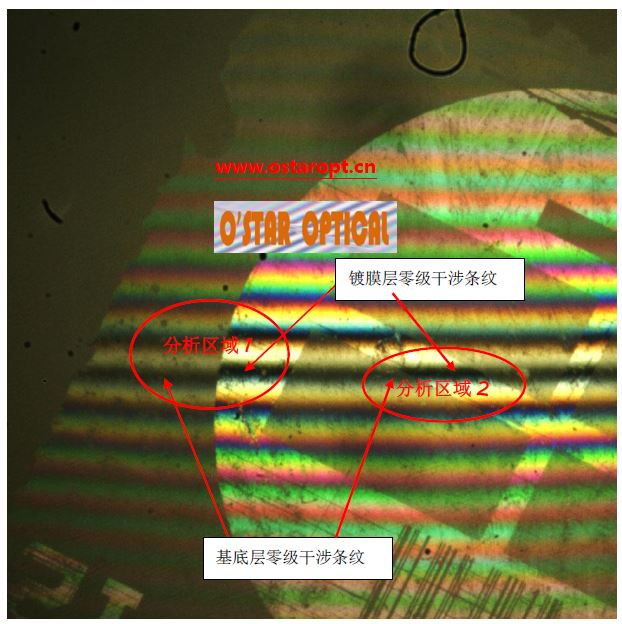
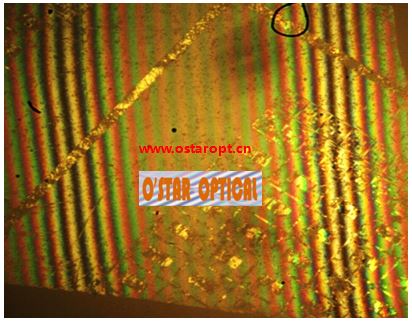
White light interference fringe pattern
As shown in the figure, the tested sample is an optical component inside a linear scale. It can be seen from the image that the large circular area is the area coated with a reflective film, the surrounding area is the substrate part, and the area without interference fringes is the non-sample area. The left red circle is analysis area 1, and the right red circle is analysis area 2. In analysis area 1, the zero-order interference fringe of the coated surface and the zero-order interference fringe of the substrate are clearly not the same interference fringe. The zero-order interference fringe of the coating layer is about half the width of a zero-order interference fringe above the zero-order interference fringe of the substrate. The central wavelength of the light source is 580nm, from which it can be calculated that the thickness of the coated area is 145nm.
In analysis area 2, judging from the shape of the zero-order interference fringe, the coated part of this area has a smaller thickness compared to the uncoated area, with a thickness of about 58nm. This is relatively close to the measurable limit of the instrument.
2.Local crack detection
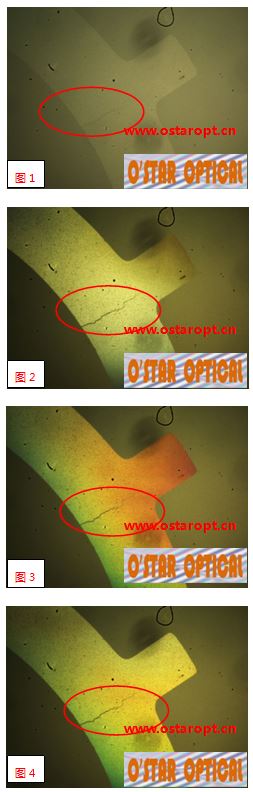
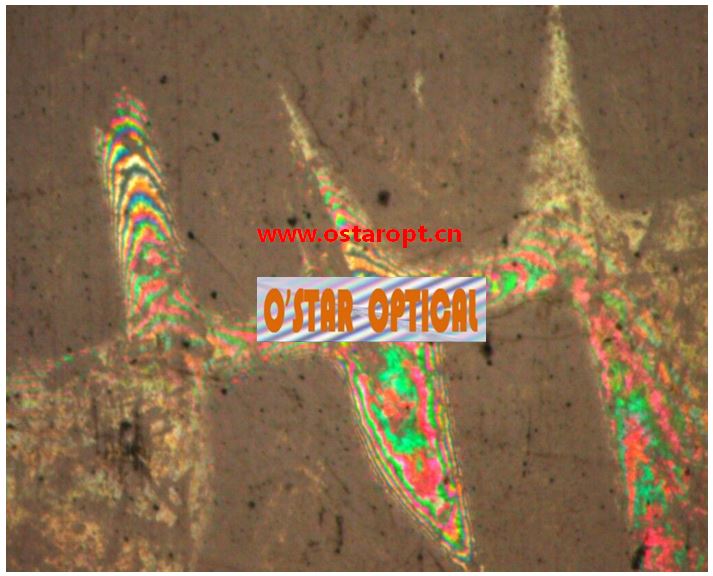
As shown in the figure, the tested sample is a polished ceramic component. The crack part is compared between detection under a microscope and detection using white light interference fringes. Figure 1 is an image of the crack area taken under a microscope. Figures 2, 3, and 4 are images of the crack detected using white light interference fringe color bands.
Comparing the four images, it can be clearly seen that the crack image obtained using white light interference fringe color band detection is clearer than the image obtained by microscopic observation. This indicates that with the help of white light interference,不明显 surface defects can be more clearly revealed, facilitating detection.
3.Same chip, different observation effects.
As shown in the figure, the upper picture shows the effect under a microscope, and the lower picture shows white light interference detection. In the red circle area of the upper picture, the unit distribution on the chip surface is not visible, while in the interference detection picture below, there are many regularly distributed small units in this area.
In the red circle area on the right side of the picture, some units are more obvious and have clearer outlines under white light interference detection.
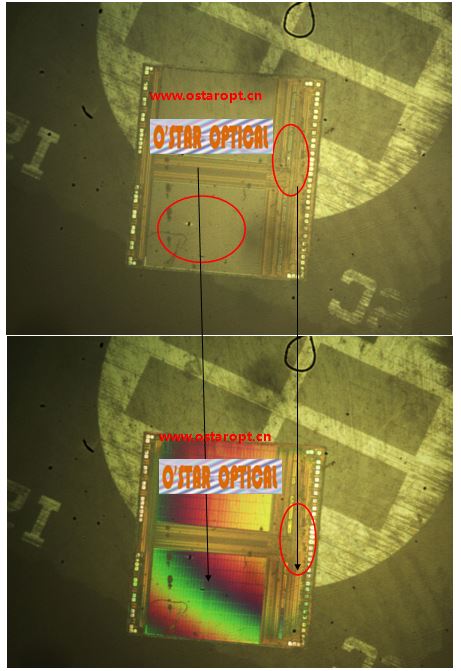
In addition, there are many more detection cases in practice. From the above case studies, under the same sample conditions, with white light interference detection, higher resolution images can be obtained, and it may even be possible to perform optical sectioning analysis on the observed sample.
4.Local micro-property changes
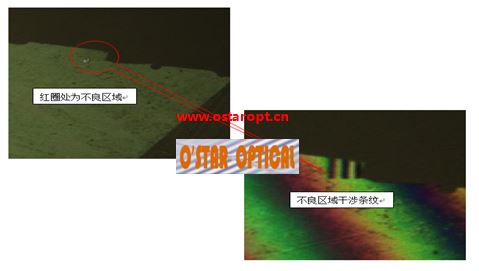
As shown in the figure, it is the detection of edge damage on an optical component. On the left is detection under a microscope, where there is no obvious difference between the defective area and the normal area. On the right is detection under white light interference. The width and direction of the interference fringes in the defective area are different from those in the normal area, and the difference is clear.
5.Coating thickness inspection
As shown in the figure, it is the coating thickness detection on the surface of an electronic component. The image shows two white light interference fringes, and the direction and width of the two interference fringes are basically the same. The coating thickness can be measured based on the relative position of the zero-order of the two interference fringes. There are two white light interference fringes in the image, indicating that there is only one coating layer. If there are multiple coating layers and the coating thickness is relatively large (greater than the width of one interference fringe), it is possible to distinguish exactly how many layers there are.
The instrument field of view is 11mm, and the coating thickness shown in the figure is about 6um.
White light interference fringes of a transmissive coating
6.Surface profile analysis
Irregular interference fringes indicate that the surface is uneven; the straighter the interference fringes, the smoother the surface. The more complex the interference fringe pattern, the more complex the surface topography. The more regular the interference fringes, the more regular the distribution of the surface topography.


 QQ客服1
QQ客服1